Fina Blocks
Think of it like building with Legos: the smallest, most fundamental piece is a Fina Block.
A Fina Block is more than just a component; it’s a versatile visual container. It lets you compute and display one or more financial metrics, whether you need a quick summary, a detailed breakdown, or a view along a timeline.
This document shows 5 examples of the most commonly used blocks to help you get started.
All examples are placed in this template, you can import it into your Fina account and start using them right away. You can also get inspired to create your own blocks.
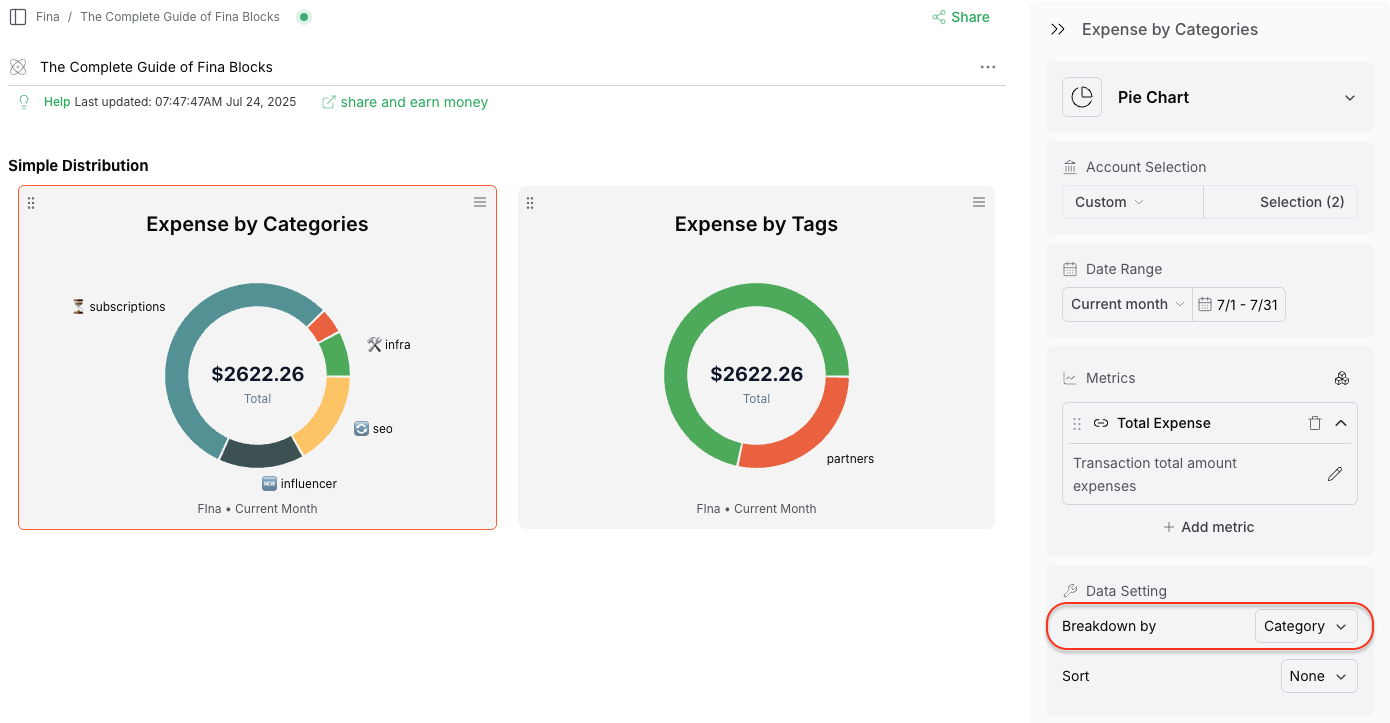
1. Simple Distributions
Want a quick overview of your money’s journey? Simple value distributions are perfect for understanding where your money came from or where it went. These are best visualized as a pie chart or a simple list.
Here’s how to create one in just a few clicks:
- Type / to bring up the prompt menu, then select "Pie Chart."
- Choose the relevant accounts and date range if you need to refine your view.
- Add the built-in metric “Total Expense.”
- In the Data Setting menu, pick a breakdown from the list: Category, Tag, Account, Area, or Merchant.
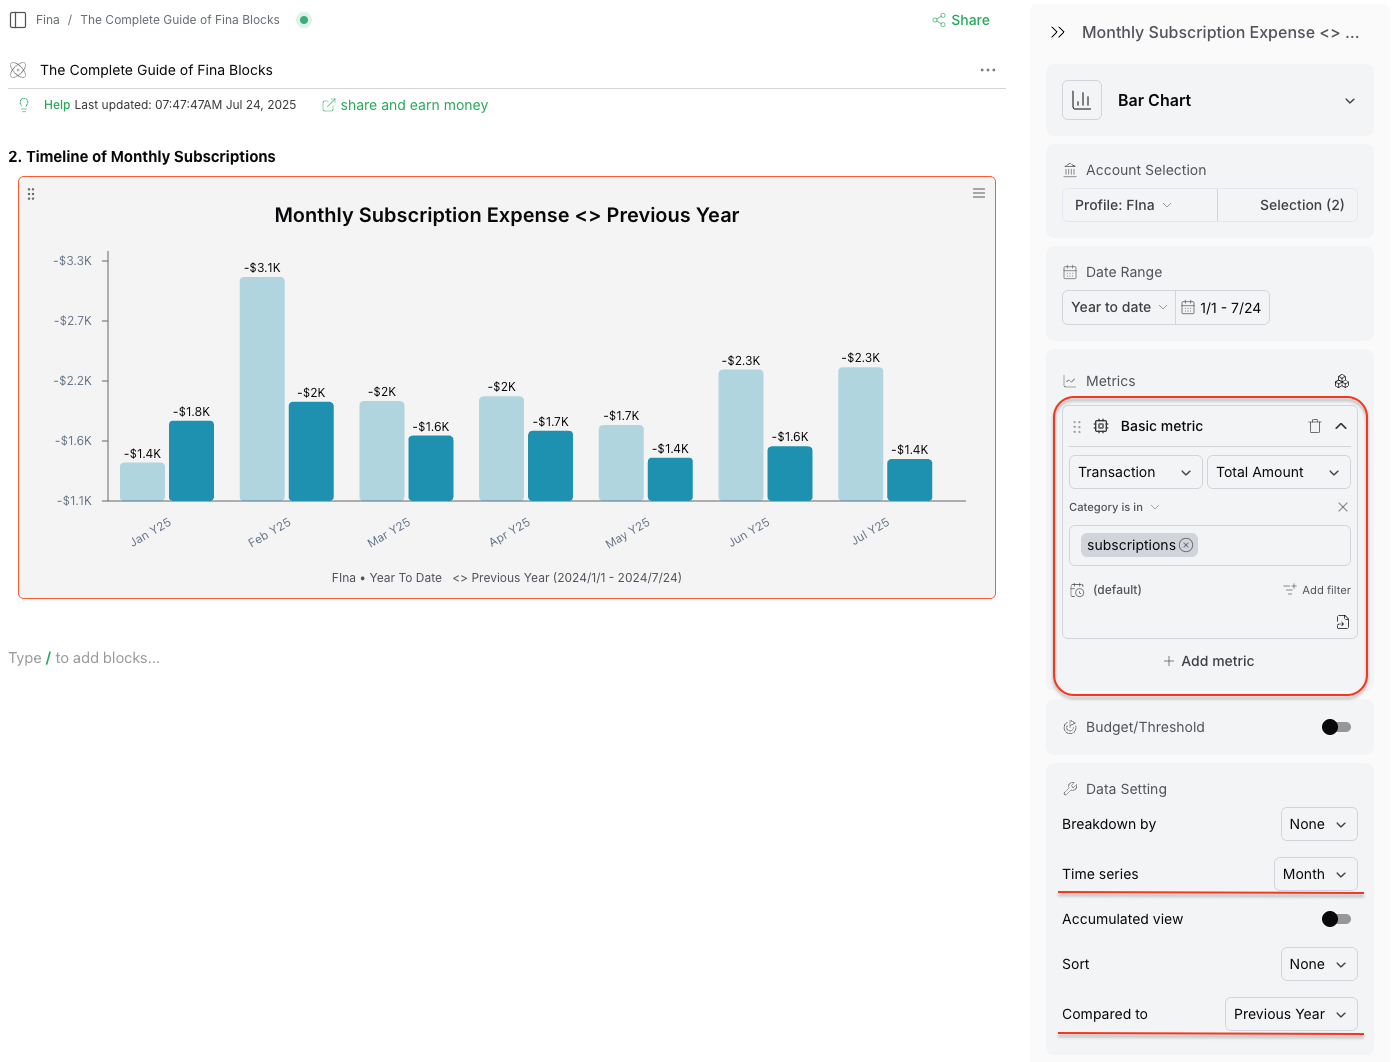
2. Timeline of Specific Metrics
Fina Metrics make it easy to define these precise questions, and a timeline block visualizes the answers clearly. A bar or line chart is perfect for this.
Here’s how to do it:
- Type / to bring up the prompt menu, then select "Time series bar chart."
- Choose “Year to date” as your Date range.
- Click “+ Add metric” to add a basic metric.
- Add a filter to focus, for example, on “Category is in ‘subscriptions’.”
- In the Data Setting menu, choose “Month” for Time series.
- Bonus Tip: For a powerful side-by-side comparison, select “Previous Year” for Compared to to see this year’s monthly spending against last year’s
Transformative views
Extra views you can apply to a timeline:
- Accumulated: Shows a running total over time.
- Growth: Displays the delta of increase or decrease over time.
- Compared to: Enables side-by-side comparisons with
- Previous periods.
- Or previous year for the same period.
You may find these options in the Data Setting panel in block editor.
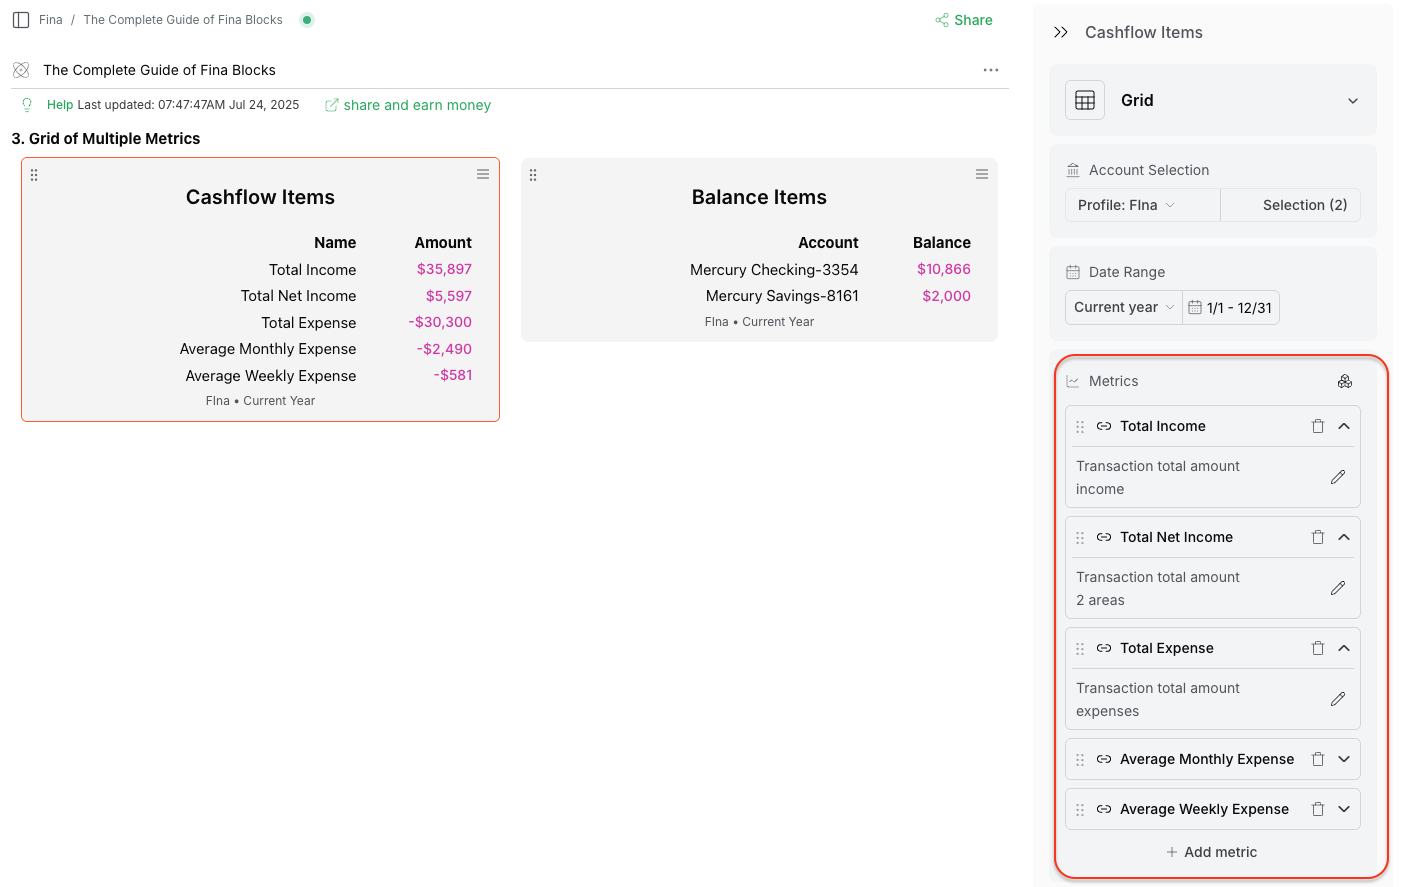
3. Combined Financial Overviews (Multiple Metrics)
A Fina Block isn’t limited to just one metric; it can display multiple metrics simultaneously.
This is incredibly useful for getting a combined financial overview rather than deep-diving into a single data point.
Let’s build two simple grids to list essential metrics for your cash flow and account balances for the current year.
Here are the steps:
- Add an empty block of any type, then change its chart type to “Grid.”
- Choose “Current year” as the time range.
- Add all these built-in metrics: Total Income, Total Net Income, Total Expense, Average Monthly Expense, Average Weekly Expense
- Similarly, for a separate “Balance Items” block, add the “Account Balance” metric.
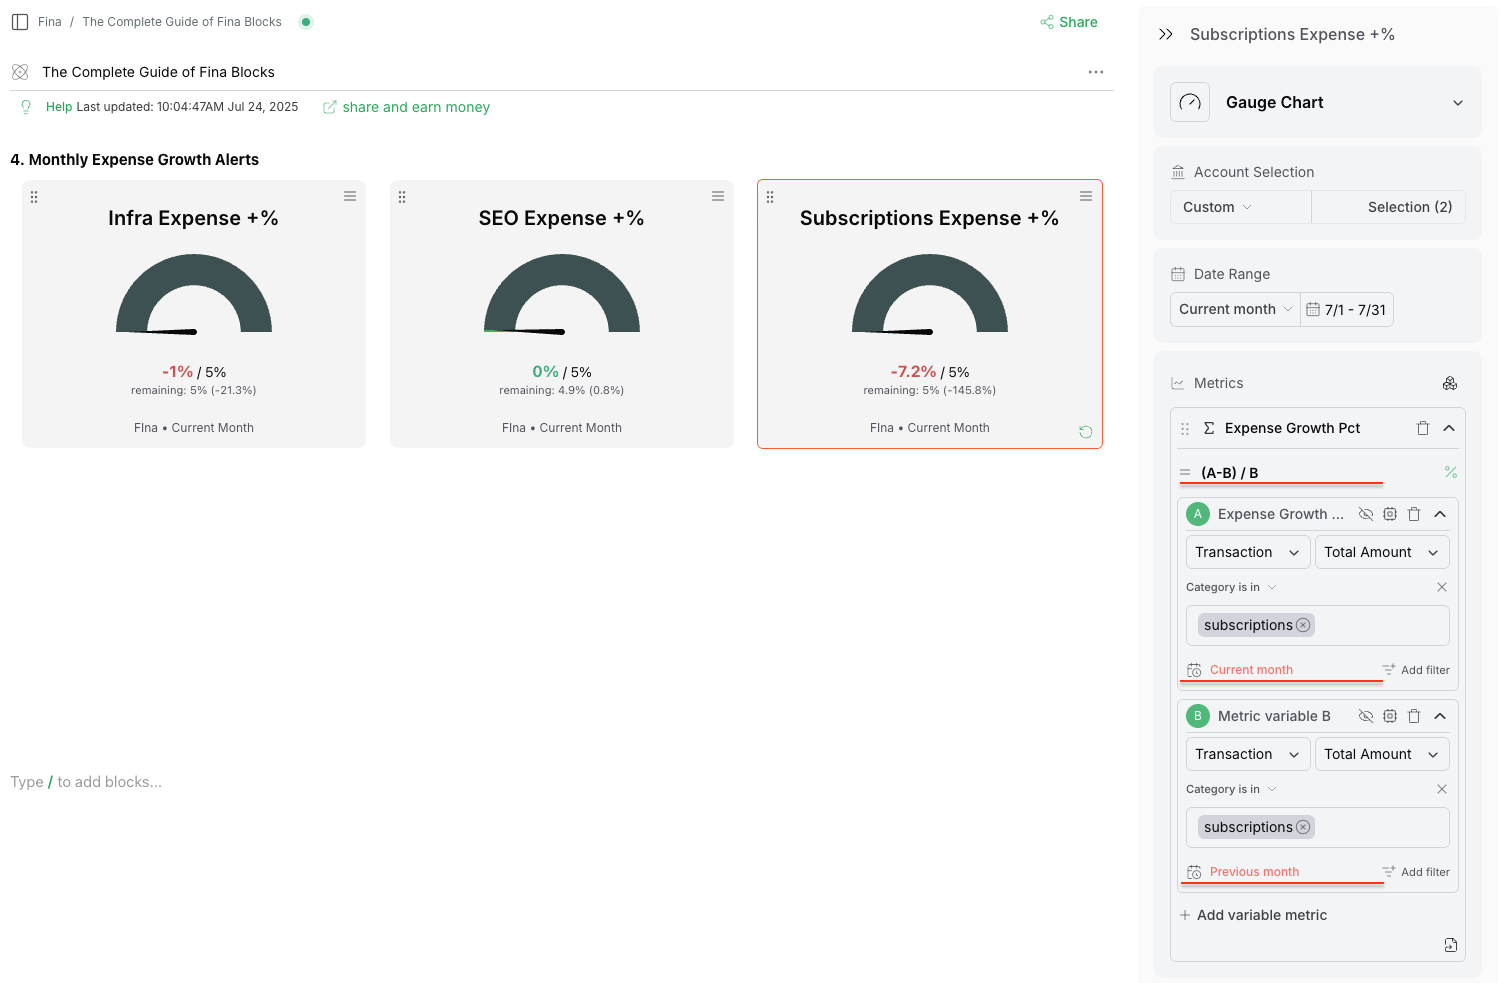
4. Custom Calculations with Formulas
Just like spreadsheets, formulas are Fina’s ultimate secret weapon, but with a significant advantage: they’re much easier to use!
You can define any interesting value as a metric and then use a formula to recompute a measurement to display.
Let’s create a powerful example: “Track monthly expense growth on each category and alert on increases over 5%.”
Here are the steps:
- Add a single number block and choose the “Gauge” chart type.
- Add a formula metric with two identical basic metrics. Each metric should represent the total amount for a specific category, like “subscriptions.”
- Click the calendar icon of the first metric and set its time range to “Current Month.”
- Click the calendar icon of the second metric and set its time range to “Previous Month.”
- Type the formula expression as
(A-B) / Band choose "%" for the value format. (Here, 'A' represents the current month's total and 'B' represents the previous month's total). - Set the threshold for the Gauge chart to 0.05 (=5%) to trigger an alert.
That’s it! To track other categories, simply copy this block and paste it twice, changing the category to “SEO” and “Infra” respectively.
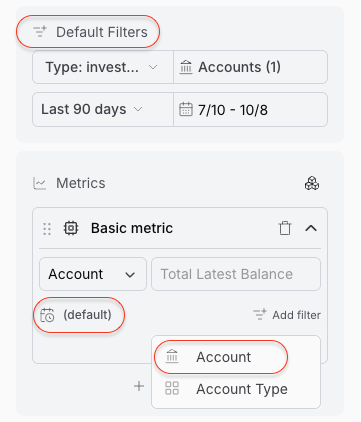
Metric Level Filters and Time Ranges
A formula usually involves multiple metrics, and each metric can have its own filters and time ranges, and even account selections. This gives the complete freedom for you to define any interesting value you want to compute based on two metrics. Below image demonstrates how to find and customize metric level filters and time ranges:
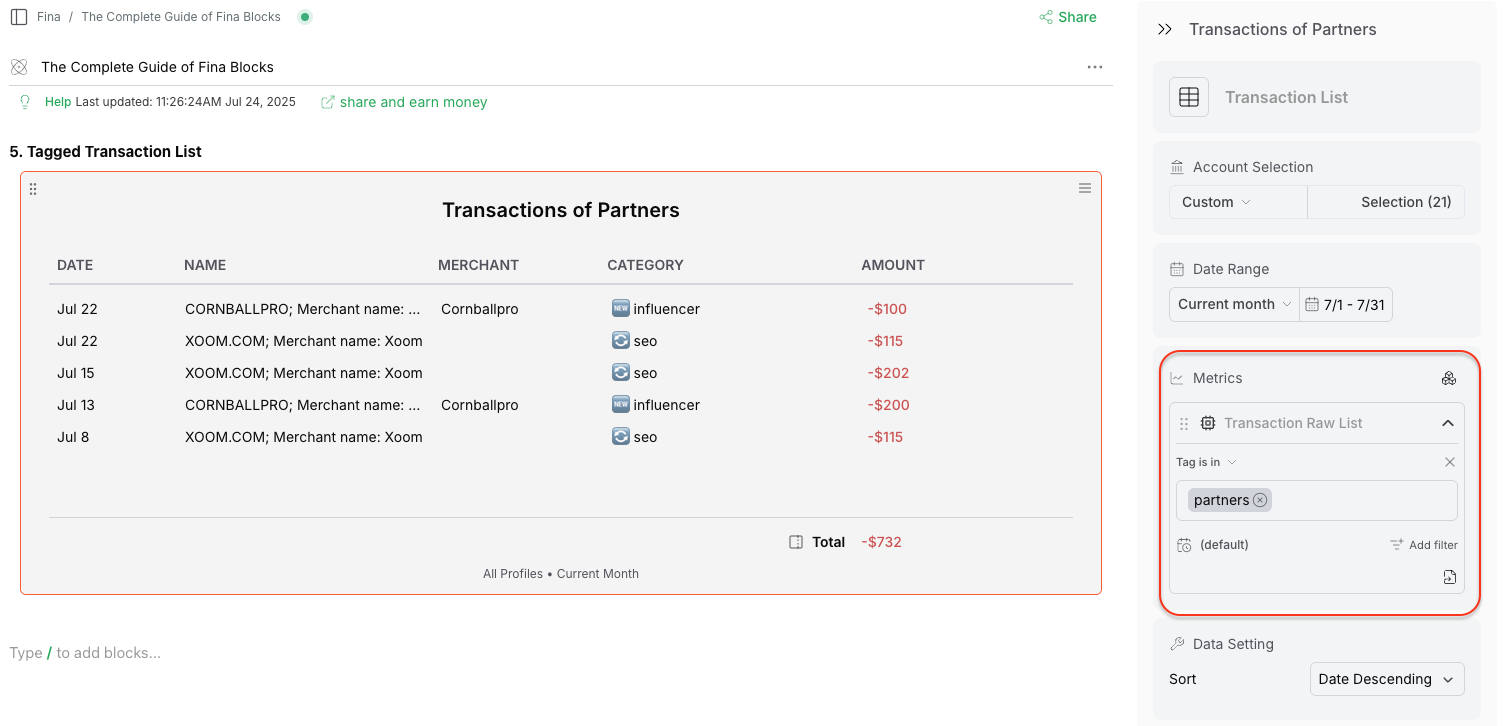
5. Fina Block for Specific Transaction Lists
Sometimes, the simplest way to stay on top of your financial activities is to observe a live list of relevant transactions.
Fina offers a special block that dynamically displays transactions based on your queries and a macro time.
Here’s how to set one up in just a few clicks:
- Add a “Transaction List” block.
- Add a filter, for example, “tag = partners”.
This list will automatically update itself as time progresses, giving you a real-time view of what matters most to you.
Summary
Fina Blocks are powerful tools that let you visualize and analyze your financial data in a way that suits your needs. Whether you want to track expenses, visualize trends, or create custom metrics, Fina Blocks have you covered.
Again, all the examples can be found in this template.